Key Takeaways
- Sold listings totaled 207 in August 2026, with 1,746 active listings and 262 pending listings across West Palm Beach.
- The absorption rate tightened to 6.27 months, down from 9.35 months a year ago, moving West Palm Beach closer to a balanced market.
- The average list price jumped 37.1% year over year to $1,247,564, while the average sale price rose 21.0% to $582,009, reflecting strong activity in higher-end segments.
- The median list price fell 7.4% to $315,000, and the median sale price eased 3.1% to $332,500, so prices at the middle of the market were more measured.
- Market time stayed steady, with average CDOM at 85 days (vs 86) and median CDOM at 54 days (vs 52).
- Year-to-date through August, the absorption rate stands at 7.94 months, average sale price at $728,090, and median sale price at $410,000.
The West Palm Beach August 2026 housing market report shows a market that is much better balanced than it was a year ago. Sold listings totaled 207, active inventory stood at 1,746, and pending listings reached 262 at the end of the month.
Prices tell two stories. The average list price jumped 37.1% year over year to $1,247,564, and the average sale price rose 21.0% to $582,009, lifted by waterfront and higher-end activity. At the median, both list and sale prices eased, with the median list price down 7.4% to $315,000 and the median sale price down 3.1% to $332,500. The absorption rate tightened from 9.35 months to 6.27 months, a sign that demand strengthened relative to supply.
I am Rhonda Townsend with RE/MAX Excellence. After more than 12 years of helping buyers and sellers throughout Palm Beach County, including West Palm Beach, I know that city-level data tells a more useful story than countywide averages alone. This report covers the full August 2026 numbers, the year-over-year comparison, the year-to-date trends, and what they may mean for your next move.
What Are the Key West Palm Beach Housing Market Numbers for August 2026?
Here is a snapshot of the West Palm Beach housing market at the end of August 2026, straight from the Beaches MLS market summary.
| Market Indicator | August 2026 |
|---|---|
| Sold Listings | 207 |
| Active Listings | 1,746 |
| Pending Listings | 262 |
207
Sold Listings
1,746
Active Listings
262
Pending
These numbers reflect completed transactions and active inventory for the full month of August 2026. Pending listings at 262 offer a look ahead at closings expected in the coming weeks, a healthy pipeline heading into the fall market.
How Did West Palm Beach Compare to August 2025?
Across nearly every measure, West Palm Beach prices and market conditions shifted compared to August 2025. Scroll the table sideways on smaller screens to see all columns.
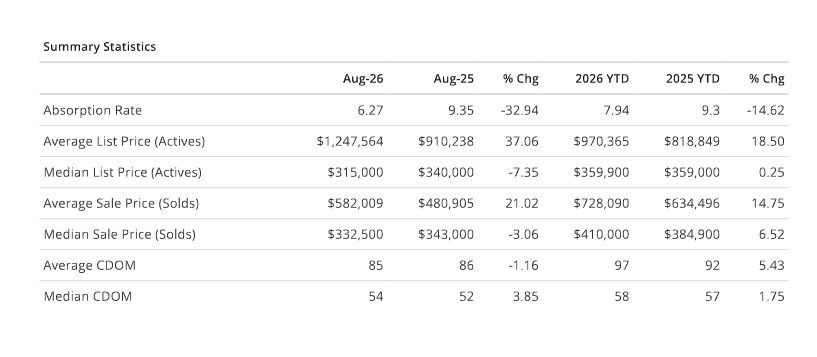
| Metric | August 2026 | August 2025 | Change |
|---|---|---|---|
| Absorption Rate | 6.27 months | 9.35 months | Down 32.9% |
| Average List Price | $1,247,564 | $910,238 | Up 37.1% |
| Median List Price | $315,000 | $340,000 | Down 7.4% |
| Average Sale Price | $582,009 | $480,905 | Up 21.0% |
| Median Sale Price | $332,500 | $343,000 | Down 3.1% |
| Average CDOM | 85 days | 86 days | Down 1 day |
| Median CDOM | 54 days | 52 days | Up 2 days |
Absorption Rate
Average List Price
Median List Price
Average Sale Price
Median Sale Price
Average CDOM
Median CDOM
The most dramatic move was in the average list price, which jumped 37.1% compared to a year ago to $1,247,564. That large jump is driven in part by waterfront and higher-end listings, where a relatively small number of high-value properties can move the average significantly.
The median measures paint a more measured picture. The median list price of $315,000 was down 7.4%, and the median sale price of $332,500 was down 3.1%. That mix is a reminder that West Palm Beach's market spans everything from downtown waterfront condos to affordable family neighborhoods, and conditions vary a lot by price band.
What Do the 2026 Year-to-Date Numbers Show for West Palm Beach?
Year-to-date data smooths out monthly ups and downs and shows the broader direction of the West Palm Beach market through the first eight months of 2026.
| Metric | 2026 YTD |
|---|---|
| Absorption Rate | 7.94 months |
| Average List Price | $970,365 |
| Median List Price | $359,900 |
| Average Sale Price | $728,090 |
| Median Sale Price | $410,000 |
| Average CDOM | 97 days |
| Median CDOM | 58 days |
7.94 mo
Absorption
$970K
Avg List Price
$359,900
Median List Price
$728K
Avg Sale Price
$410,000
Median Sale Price
97
Avg CDOM
58
Median CDOM
The year-to-date median sale price of $410,000 and average sale price of $728,090 show that West Palm Beach home values have held up through 2026 even as monthly medians eased in the summer. With the year-to-date absorption rate at 7.94 months, the market has remained broadly balanced over the first eight months of the year.
Key Takeaways from the August 2026 West Palm Beach Market
Beyond the raw numbers, a few themes stand out for anyone watching the West Palm Beach market this month.
First, demand has strengthened relative to supply. The absorption rate falling from 9.35 months to 6.27 months is the biggest single signal in this report, and it means buyers and sellers are closer to meeting in the middle than they were a year ago. Second, high-value listings are reshaping the average. The average list price jumping 37.1% while the median list price fell 7.4% tells us that luxury, waterfront, and downtown inventory is a larger share of what is on the market, while more moderately priced homes are being listed at more measured levels. Third, market time stayed essentially flat, with the median home selling in about 54 days, so planning your listing or offer timing matters more than rushing a transaction.
What Do These Numbers Mean for West Palm Beach Buyers?
For buyers, the eased median prices and the tighter absorption rate make for an interesting moment. The median sale price at $332,500 is modestly below a year ago, which can help in more moderately priced neighborhoods, while the absorption rate near six months tells you that reasonably priced homes still move at a steady pace. Being pre-approved and ready to act remains the best strategy, especially when a well-priced waterfront or move-in-ready home hits the market.
If you are new to the area or buying from out of state, my buying guide and relocation resources can help you navigate the process. For waterfront buyers specifically, my waterfront buyers guide covers docks, seawalls, canals, and insurance questions before you make an offer. You can also explore West Palm Beach neighborhoods through my West Palm Beach community guide.
What Do These Numbers Mean for West Palm Beach Sellers?
For sellers, the story is more split. If you own a higher-end, waterfront, or downtown property, conditions look strong: average list prices are up sharply, and well-presented properties in that segment continue to attract attention. If your home sits in a more moderate price band, competition from nearby inventory means pricing realistically and preparing your home well are essential, especially with the median list price down 7.4%.
If you are planning to sell and buy at the same time, coordination is everything. My guide to selling and buying at the same time walks through the order of operations, and my selling guide covers pricing, marketing, and preparing your home for the market. My preparation checklist is a good place to start.
Keep Up with the Latest West Palm Beach and Palm Beach County Market Reports
Market conditions shift month to month, so I publish regular updates for West Palm Beach, Wellington, Lake Clarke Shores, and Palm Beach County. Recent reports include the Palm Beach County August 2026 market report, the West Palm Beach July 2026 report, the Wellington July 2026 report, and the Lake Clarke Shores July 2026 report. You can browse all of them from the full articles page, or visit the West Palm Beach market report page for a quick snapshot.
Download the Full West Palm Beach Market Summary
The numbers above are drawn from the Beaches MLS Market Summary for West Palm Beach. The full West Palm Beach market summary PDF is available in the site documents/downloads, and I have also linked the countywide August 2026 summary below, which adds area-by-area context for the whole county.
Download the West Palm Beach Market Summary PDF · Download the Palm Beach County August 2026 Market Summary (PDF)
If you would like a personalized take on how these numbers apply to your West Palm Beach neighborhood, price range, or timeline, I am happy to help. No pressure, just a clear plan for your next move.
Data cited in this article comes from the Beaches MLS Market Summary for West Palm Beach, August 2026. Figures reflect residential market activity for the month unless noted, and are subject to revision.
Want a Closer Look at the West Palm Beach Market?
Whether you want a personalized market analysis for your West Palm Beach neighborhood or a step-by-step plan for your next move, I'm here to help with honest, expert guidance and no pressure.
Rhonda Townsend, REALTOR® · A.I. Certified Agent™ · RE/MAX Excellence
(561) 236-9772 ·
rtownsend@remax.net
Frequently Asked Questions
Sources
Sources referenced in this article:
- • West Palm Beach Residential Market Summary PDF — Supplied Report
- • Palm Beach County Market Summary, August 2026 — Supplied Report
- • Beaches MLS — Market data source
Disclaimer: This article is provided for general educational and real estate information only. Market statistics describe broader activity and do not determine the value, selling time, or future performance of a specific property. Data is sourced from BeachesMLS and public records and may be subject to revision. Consult a qualified professional regarding your individual circumstances.