Key Takeaways
- Closed sales totaled 1,915 in July 2026, with pending listings reaching 1,983 and active inventory at 12,101.
- The median sale price rose 13.09% year over year to $531,500, while the absorption rate tightened from 8.2 to 5.68 months.
- Homes sold 12 days faster at the median compared to July 2025, with the median days on market dropping from 55 to 43 days.
- The year-to-date absorption rate declined from 8.27 months to 6.7 months, a drop of nearly 19% compared to the first seven months of 2025.
- Palm Beach County is close to a balanced market overall, though conditions vary significantly by neighborhood, price range, and property type.
The Palm Beach County July 2026 housing market report shows a market that is gaining strength compared to last year while continuing to shift month to month. Closed sales totaled 1,915, pending listings reached 1,983, and active inventory stood at 12,101 at the end of the month.
Prices moved higher on a year-over-year basis. Homes sold faster than they did a year ago. And the absorption rate tightened significantly compared to July 2025, meaning the market is closer to balance than it was twelve months ago.
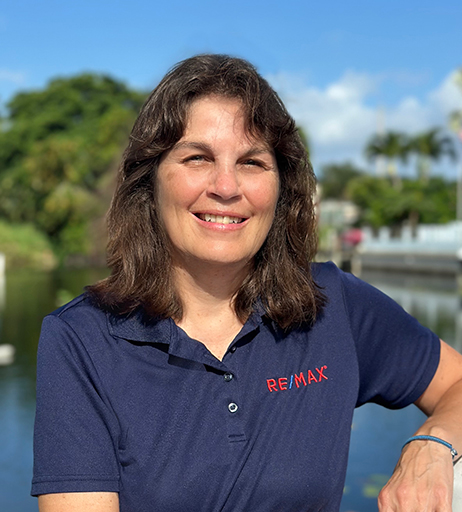
I am Rhonda Townsend with RE/MAX Excellence. After more than 12 years of helping buyers and sellers throughout Palm Beach County, I have learned that monthly reports are most useful when we connect them to your specific neighborhood, property type, and goals. This report covers the full July 2026 numbers, year-over-year comparisons, and what they may mean for your next move.
What Are the Key Palm Beach County Housing Market Numbers for July 2026?
Here is a snapshot of the Palm Beach County housing market at the end of July 2026.
| Market Indicator | July 2026 |
|---|---|
| Closed Sales | 1,915 |
| Pending Listings | 1,983 |
| Active Listings | 12,101 |
| Median Sale Price | $531,500 |
| Average Sale Price | $1,013,567 |
| Median List Price (Active) | $475,000 |
| Average List Price (Active) | $1,433,757 |
| Absorption Rate | 5.68 months |
| Median Days on Market | 43 |
| Average Days on Market | 82 |
1,915
Closed Sales
1,983
Pending
12,101
Active Listings
$531.5K
Median Sale Price
$1.01M
Avg Sale Price
5.68 mo
Absorption Rate
43
Median DOM
82
Avg DOM
These numbers reflect completed transactions and active inventory for the full month of July 2026. They provide a clearer picture than mid-month snapshots because they include all closed sales from the beginning through the end of the month.
How Did Palm Beach County Prices Change Compared to July 2025?
Palm Beach County prices moved higher across nearly every measure when compared to July 2025.
| Metric | July 2026 | July 2025 | Change |
|---|---|---|---|
| Median Sale Price | $531,500 | $470,000 | Up $61,500 (13.09%) |
| Average Sale Price | $1,013,567 | $763,431 | Up $250,136 (32.76%) |
| Median List Price (Active) | $475,000 | $479,000 | Down $4,000 (-0.84%) |
| Average List Price (Active) | $1,433,757 | $1,228,271 | Up $205,486 (16.73%) |
Median Sale Price
Average Sale Price
Median List Price (Active)
Average List Price (Active)
The most significant jump was in the average sale price, which rose 32.76 percent compared to a year ago. That increase was driven in part by a strong luxury market, where a relatively small number of high-value transactions can move the countywide average significantly.
The median sale price provides a more stable measure of the broader market. At $531,500, it was up 13.09 percent compared to $470,000 in July 2025. That is a meaningful increase and suggests that the typical home in Palm Beach County sold at a higher price than it did twelve months ago.
Interestingly, the median active list price declined slightly, falling from $479,000 to $475,000. This could indicate that newer listings entering the market are being priced more conservatively, even as homes that closed during the month reflected higher values.
What Do the Year-to-Date Numbers Show?
Year-to-date data helps smooth out monthly fluctuations and shows the broader direction of the market.
| Metric | 2026 YTD | 2025 YTD | Change |
|---|---|---|---|
| Median Sale Price | $525,000 | $500,000 | Up 5.00% |
| Average Sale Price | $1,027,471 | $909,438 | Up 12.98% |
| Median List Price (Active) | $499,990 | $498,600 | Up 0.28% |
| Average List Price (Active) | $1,230,877 | $1,118,500 | Up 10.05% |
| Absorption Rate | 6.7 months | 8.27 months | Down 18.98% |
| Average Days on Market | 90 | 88 | Up 2.27% |
| Median Days on Market | 52 | 55 | Down 5.45% |
Median Sale Price
Absorption Rate
Median Days on Market
Avg Days on Market
The year-to-date median sale price of $525,000 is up 5 percent compared to the first seven months of 2025. The average sale price is up nearly 13 percent. Both figures confirm that Palm Beach County home values have moved higher in 2026.
The absorption rate declined from 8.27 months year-to-date in 2025 to 6.7 months in 2026, a drop of almost 19 percent. That is a significant shift. It means the market is absorbing inventory at a faster pace than it was a year ago, bringing conditions closer to balance.
What Does a 5.68-Month Absorption Rate Mean for Palm Beach County?
An absorption rate of 5.68 months puts Palm Beach County very close to what the National Association of Realtors describes as a balanced market. Six months of supply is generally considered the line between a buyer's market and a seller's market, with the area in between representing relative balance.
At 5.68 months, neither buyers nor sellers hold a strong advantage across the entire county. Well-priced homes in desirable areas and price ranges may still attract multiple offers and sell quickly. Properties that are overpriced, need significant work, or carry high association fees may take longer.
The key improvement is the year-over-year shift. In July 2025, the absorption rate was 8.2 months, which was firmly in buyer's-market territory. The drop to 5.68 months reflects stronger demand and tighter inventory compared to a year ago.
How Did Palm Beach County Homes Perform in Terms of Market Time?
Homes sold faster in July 2026 than they did in July 2025.
| Metric | July 2026 | July 2025 | Change |
|---|---|---|---|
| Median Days on Market | 43 | 55 | Down 12 days (-21.82%) |
| Average Days on Market | 82 | 87 | Down 5 days (-5.75%) |
Median Days on Market
Average Days on Market
The median days on market dropped from 55 days to 43 days, a reduction of nearly 22 percent. That means half of all homes that sold in July went under contract in 43 days or fewer. That is a meaningful improvement for sellers.
The average days on market also improved, declining from 87 to 82 days. The gap between the median and average suggests that some properties are still taking longer to sell, but the typical transaction moved more quickly than it did a year ago.
For buyers, faster-moving markets mean less time to deliberate. Well-priced homes in good condition are likely to attract attention quickly. Having financing, pre-approval, and priorities organized before starting a search can make a real difference.
What Happened to Palm Beach County Inventory in July 2026?
Active inventory stood at 12,101 at the end of July. For context, the mid-July snapshot showed 11,981 active listings. That means inventory ticked up slightly during the second half of the month, adding 120 listings.
This is normal seasonal behavior. Some sellers list their homes in late July and August in preparation for fall moves. New construction also continues to add inventory in certain Palm Beach County communities.
With 1,915 closed sales and 1,983 pending listings during July, demand remained steady. The combination of steady sales activity and relatively stable inventory is what keeps the absorption rate near balance.
For sellers, 12,101 active listings means your home is competing with roughly the same number of properties as it was in June and mid-July. Presentation, pricing, and marketing remain the factors that separate homes that sell quickly from those that sit.
What Do These Numbers Mean for Palm Beach County Buyers?
Buyers in Palm Beach County face a market that is tighter than it was a year ago but still offers room to negotiate.
The median sale price of $531,500 is up 13 percent year over year, which means buyers are paying more for the typical home than they were in July 2025. At the same time, the median list price of $475,000 suggests that many homes are being listed at prices below the eventual sale price, which could indicate competitive bidding on well-positioned properties.
However, the sale-to-list dynamics vary by price range and community. Buyers should consider the full picture when evaluating a property:
- The home's condition and any updates or repairs needed
- Association fees, insurance costs, and property taxes
- The property's time on the market and any price adjustments
- Recent comparable sales in the same neighborhood or building
- The overall competitiveness of the specific price range
An absorption rate near 5.68 months means buyers are not facing the extreme competition of a hot seller's market, but they are also not in a position where they can make lowball offers and expect acceptance. Preparation, realistic expectations, and good local guidance matter.
What Do These Numbers Mean for Palm Beach County Sellers?
Sellers entering the market in August should feel encouraged by several trends, but they should also price realistically.
The year-over-year improvement in market time is significant. Homes sold 12 days faster at the median compared to July 2025. The absorption rate dropped from 8.2 months to 5.68 months. Both figures suggest that demand has strengthened.
At the same time, the slight decline in median list price from $479,000 a year ago to $475,000 today suggests that buyers are price sensitive. Homes that are priced in line with current conditions are more likely to attract attention and sell closer to asking.
Here is what sellers should focus on:
- Price accurately based on recent comparable sales
- Invest in presentation, photography, and online marketing
- Address obvious repairs and maintenance before listing
- Be responsive to showing requests and buyer feedback
- Work with an agent who understands local pricing and market dynamics
Lower inventory compared to a year ago is an advantage, but it is not a guarantee. Homes that are well prepared and properly priced are the ones that benefit most from favorable market conditions.
How Does July 2026 Compare to Mid-July 2026?
For readers who followed the mid-July update, here is how the full-month numbers compare.
| Metric | Mid-July (Jul 15) | End of July | Change |
|---|---|---|---|
| Active Listings | 11,981 | 12,101 | Up 120 |
| Median Sale Price | $542,500 | $531,500 | Down $11,000 |
| Median List Price | $480,000 | $475,000 | Down $5,000 |
| Absorption Rate | 5.64 months | 5.68 months | Up 0.04 months |
Active Listings
Median Sale Price
Absorption Rate
The second half of July brought a small increase in active inventory and a modest pullback in median prices. This is not unusual. The final two weeks of any month can include a mix of transactions, and late-month closings do not always mirror the pace or price profile of early-month deals.
The overall market direction remained consistent. Inventory stayed relatively tight, homes sold faster than a year ago, and the absorption rate stayed near balance.
Why Countywide Numbers Do Not Tell the Whole Story
Palm Beach County is made up of many smaller markets, and conditions can vary significantly by community, property type, and price range.
A countywide median of $531,500 reflects transactions across Wellington, West Palm Beach, Boca Raton, Delray Beach, Boynton Beach, Jupiter, Palm Beach Gardens, Lake Clarke Shores, Royal Palm Beach, and dozens of other communities. It also includes condominiums, townhomes, single-family homes, waterfront properties, and luxury estates.
Two homes in the same city may perform differently because of:
- Property type, age, and condition
- Renovations and upgrades
- Lot size, view, and water access
- Association rules and monthly expenses
- Insurance requirements and flood zone designation
- Competition within the same price range
- School proximity and community amenities
This is why countywide statistics work best as a starting point. The next step is to narrow the data to the specific community, property type, and price range that matter to you. A neighborhood-level analysis will help you make decisions based on your specific situation.
How Can an AI Certified Agent Help You Make Sense of These Numbers?
As an AI Certified Agent, I use modern tools to organize market data, improve property marketing, and communicate more efficiently while continuing to provide the personal guidance that a real estate transaction requires.
For sellers, AI-supported tools help with creating property-specific marketing content, organizing listing information across multiple platforms, identifying the right audience for targeted promotion, and reviewing engagement so the strategy can be adjusted when needed.
For buyers, these tools help organize property information, compare options, and streamline communication. That frees up more time for the human parts of the process, including listening to your priorities, evaluating properties, negotiating terms, and guiding you through closing.
Technology works best when it is paired with local experience. After more than 12 years in Palm Beach County, I know that numbers are only part of the story. Your timing, comfort level, goals, and the specific community you are targeting all matter.
What Is the Bottom Line for Palm Beach County Buyers and Sellers?
The Palm Beach County July 2026 market report shows a market that is stronger than a year ago and closer to balance.
The median sale price rose 13 percent year over year to $531,500. Homes sold 12 days faster at the median. The absorption rate tightened from 8.2 months to 5.68 months. Active inventory remained stable near 12,000 listings.
For buyers, that means higher prices than a year ago but a less frantic environment than a peak seller's market. Preparation and good local knowledge remain essential.
For sellers, it means less competition than a year ago and faster sales, but it also means buyers are still comparing options and evaluating value carefully.
Whether you are buying or selling in Palm Beach County, a neighborhood-level analysis will help you make decisions based on your specific situation rather than broad countywide trends.
Thinking about your next move? Contact Rhonda Townsend at RE/MAX Excellence for a personalized review of your market, neighborhood, and price range. Together, we can turn these numbers into a strategy that fits your goals.
"Your timing, comfort level, and long-term goals matter just as much as the market data. Let us look at the numbers together and build a plan that makes sense for you."
— Rhonda Townsend, REALTOR® with RE/MAX Excellence
Have Questions About Your Palm Beach County Market?
Whether you want a personalized market analysis for your neighborhood or a step-by-step plan for your next move, I'm here to help — with no pressure and honest, expert guidance.
Rhonda Townsend, REALTOR® · A.I. Certified Agent™ · RE/MAX Excellence
(561) 236-9772 ·
rtownsend@remax.net
Frequently Asked Questions
Sources
Sources referenced in this article:
- • Palm Beach Residential Market Summary, July 2026 — Supplied Report
- • Palm Beach Residential Market Summary, July 2025 — Supplied Report
- • National Association of Realtors — Strength in Numbers
- • Florida Realtors — Florida Market Reports
- • Realtor.com — Palm Beach County Housing Market Report
Disclaimer: This article is provided for general educational and real estate information only. Market statistics describe broader activity and do not determine the value, selling time, or future performance of a specific property. Data is sourced from BeachesMLS and public records and may be subject to revision. Consult a qualified professional regarding your individual circumstances.